Get Fit & Ride your "Bicycle" ;)
Cycle Analysis
There are many tools that the professional Technician uses to examine the Market. For most, there are a select group of favorite indicators that are tried and true. The problem with using these is that the analysis becomes and remains stagnant in a Market environment where the only constant is change!
While those select and “go-to” indicators might prove reliable one day, they may disappoint on others. The fact of the matter is that as Day Traders, we need to utilize everything at our disposal to predict price targets and profit from our intense labor.
Which brings us to today’s lesson: Market Cycles.
Market Cycle is a term used frequently to analyze and predict trends or patterns that emerge during different business environments or stages. Many times, you’ll hear economists talk about the different conditions that exist in the economy and/or whether the “time” is ripe for certain events to occur. And while this application is valid in that interpretation - Technicians take this “Market Cycle” approach and extend it - by applying it on the chart of what to trade!
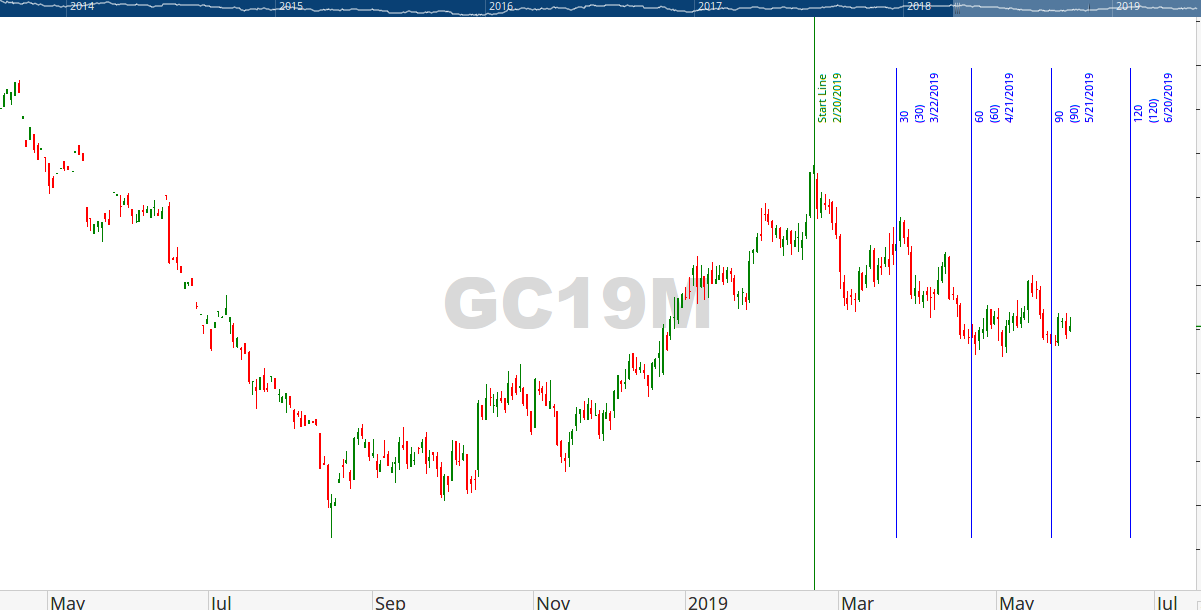
Looking at the June 2019 Gold Futures contract (GCM19) – we insert a time symmetrical cycle beginning on February 20th and extend it forward for the next 120 days. As you can see, this cycle analysis is interestingly correct in its predictions of when the “highs” and “lows” are achieved. What’s important to understand is that as a stand-alone indicator, our next “cycle” to observe would take place on June 20th.
Of course, the question remains: How do would you position your trade to take advantage of the next cycle and what would your position size be?
I can help you answer that through consultation; contact me today!
Like what you read?
Then, subscribe to our Newsletter for more Market observations and analysis!