The Momentum has it! (MS)
Relative Strength Indicator (RSI) has its advantages.
Using Momentum indicators to aid in trading decisions can be overused but, at times, it can offer insight as to what to do next.
The Relative Strength Indicator or (RSI) is one of the most popular momentum oscillators and with good reason. This handy technical analysis tool is called an oscillator because its readings stay between two extreme values; (RSI) evaluates price changes to determine an overbought or oversold condition in the price of a security. Since it oscillates between 0 and 100, an overbought condition is said to exist when the (RSI) is above 70 and an oversold condition exists when it is below a value of 30.
How is this applied to trading decisions?
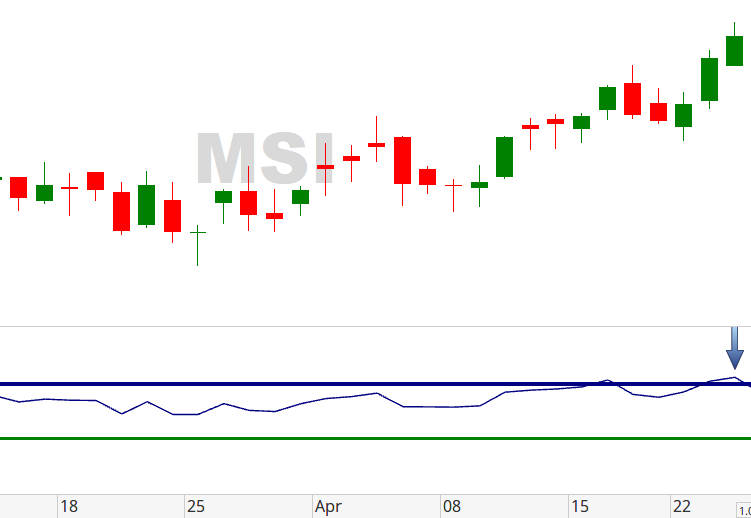
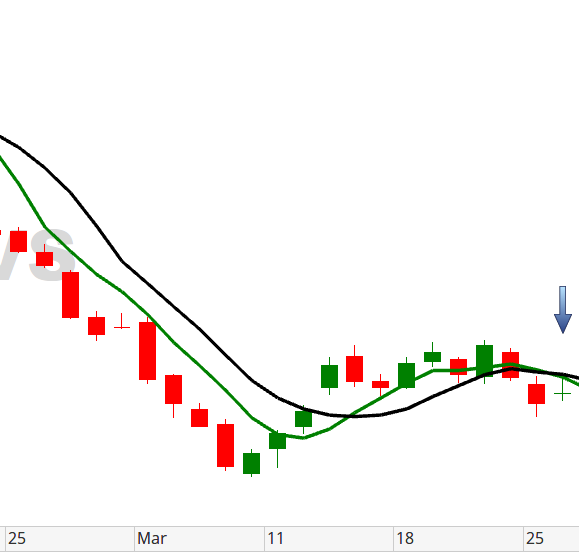
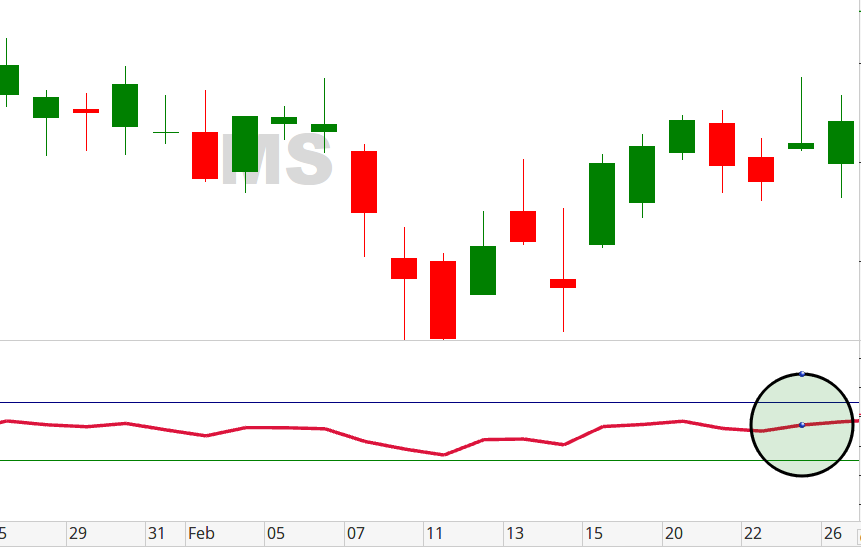
Let’s look at Morgan Stanley’s (MS) chart. As of February 26th, we notice that (MS) has been in a congestion period with little to no movement in price action. Viewing the sub-chart below the main candlestick chart, you’ll notice that the (RSI) indicator shows a near stagnant slope in its line measurement (highlighted by the circle). This fact, combined with non-existent candlestick patterns and price congestion, suggests that astute traders STAY OUT of any new positions!
That said, the question remains: When is the time right to trade? And, when a new trade is entered, should you go long or short?
I can help you answer that through consultation; contact me today!
Like what you read?
Then, subscribe to our Newsletter for more Market observations and analysis!